Did You Know?
Mobility and essential travel during COVID-19
When COVID-19 cases and deaths were rising in Chicago in March and April, the pandemic hit communities of color on the South and West Sides of Chicago at disproportionate rates.
People in communities of color were already facing disparities in income, employment, health, traffic safety, and economic disinvestment before the COVID-19 outbreak. When the pandemic hit, Black people started dying at 2-3 times the rate of the city’s White residents.
In order to gain a better understanding of the full impact of the COVID-19 pandemic on Black and Brown communities in Chicago, we wanted to look at transportation patterns among communities that were hit hardest. We also wanted to look at where essential workers live and how travel behavior changed during the stay-at-home order.
After Illinois’ stay-at-home order was enacted on May 20, various worksites across Chicago closed. While many people started working from home, certain jobs were categorized as “essential,” and those essential workers continued commuting to and from work.
When looking at the impact of the pandemic on transportation in Chicago during March and April, here are some key points:
- Research shows essential workers are more likely to live in communities that were hit hardest by COVID-19.
- The closing of various worksites had a drastic impact on travel patterns across the city during the months of March and April.
- CTA rail ridership decreased for some CTA stations at higher rates based on the location of the station.
- Red light camera tickets highlighted a decrease in traffic volume and speed camera tickets highlighted an increase in speeding across communities.
- The changes in crash data varied for car crashes, pedestrian crashes, and bike crashes reported in the communities hit hardest by COVID-19.
COMMUNITIES HARDEST HIT BY COVID-19
COVID-19 deaths by age and race in Chicago (as of May 11, 2020)

(Figures courtesy of City of Chicago)
Top five Chicago communities hit hardest by COVID-19 deaths (as of May 11, 2020)

ESSENTIAL WORKERS
The Chicago Metropolitan Agency for Planning (CMAP) released an analysis identifying who essential workers are and where they live in the Chicago metropolitan area.
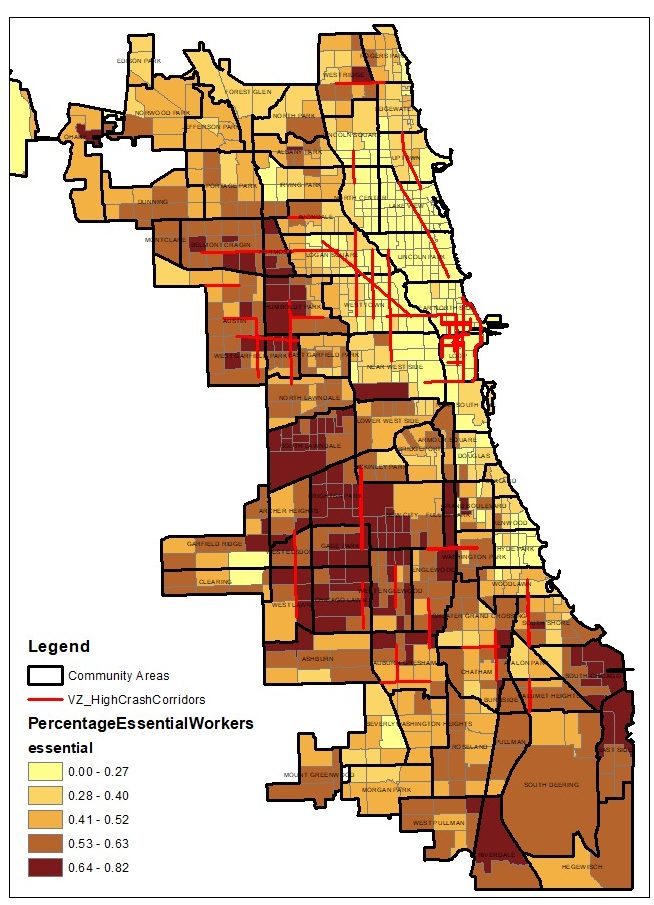
Using CMAP’s essential workers data, Active Trans mapped where essential workers live in Chicago’s community areas. This map shows the percentage of essential workers living in Chicago-based on census tracts.
There is a greater concentration of essential workers living in the South and West Side communities in Chicago. Looking at the map, essential workers are segregated in low-income communities and communities of color, which have a high disparity when it comes to contracting and spreading the disease.
Percentage of essential workers living in Chicago
TRAVEL BEHAVIOR DURING STAY-AT-HOME ORDER
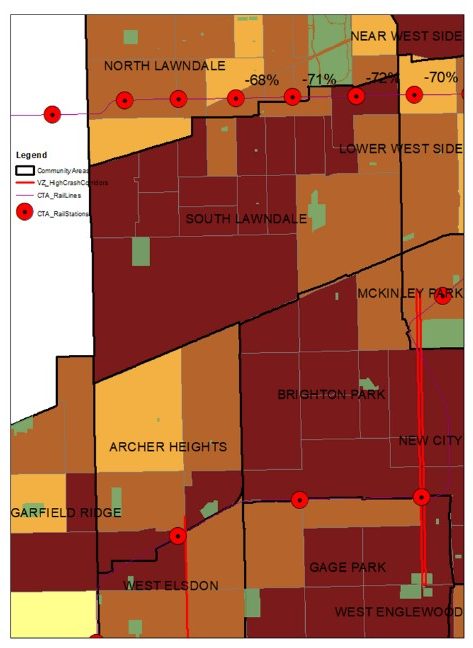
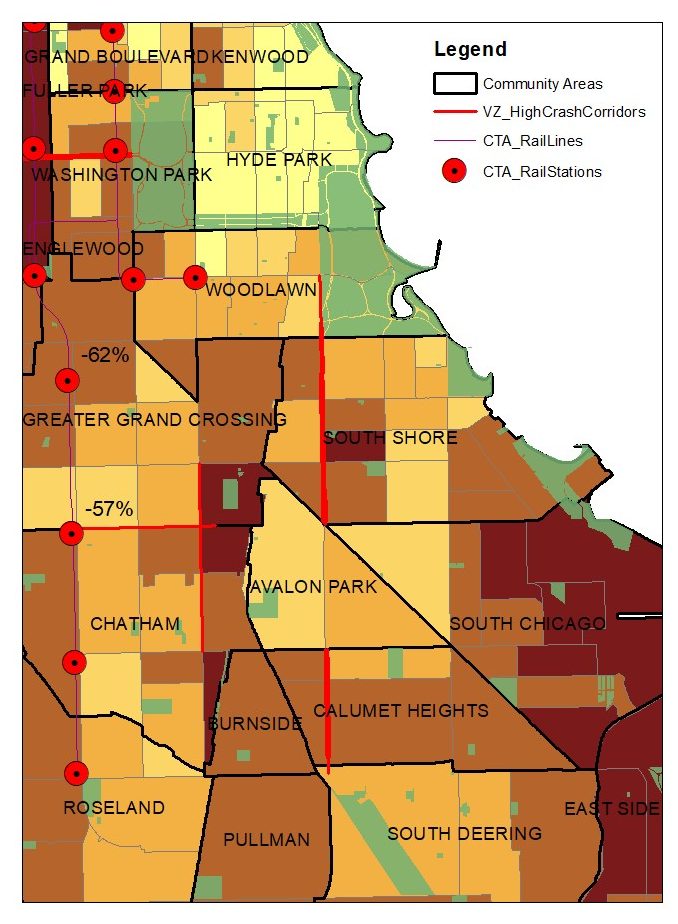
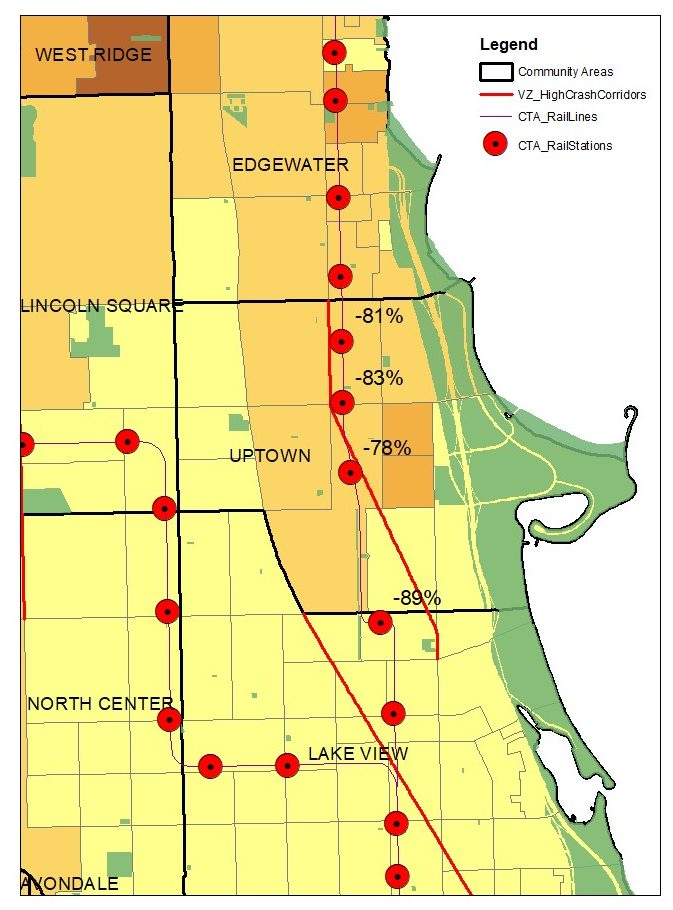
CTA rail ridership change after shutdown from March 22-28 in 2019 and 2020 in South Shore, South Lawndale, and Uptown
During March 22-28, 2020, CTA rail ridership experienced a system-wide decrease, but certain stations on the South and West Sides of Chicago saw less of a ridership drop after the stay-at-home order. This was because essential workers, most of whom live on the South and West Sides, traveled more frequently on CTA rail during the stay-at-home order.
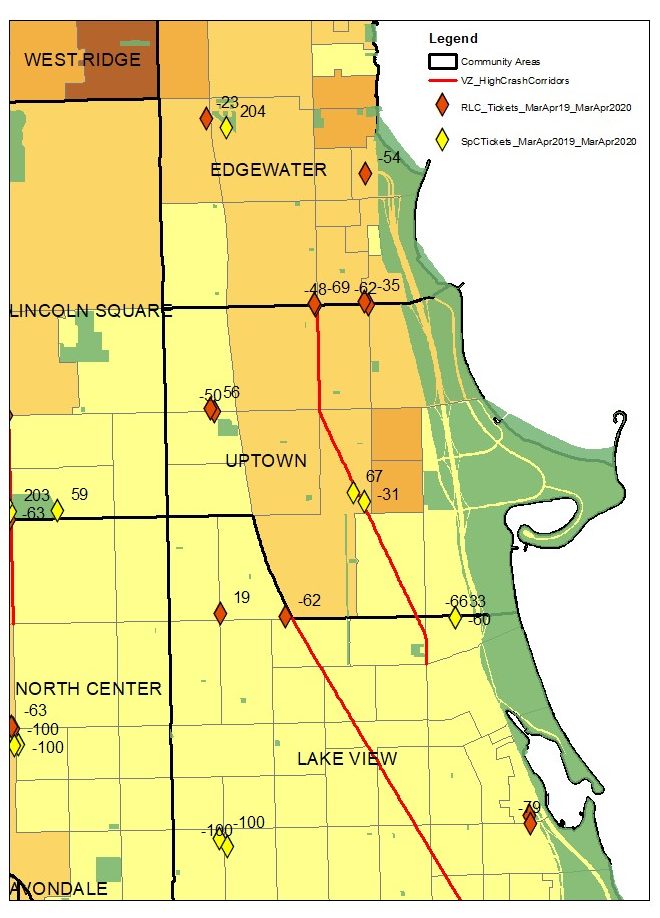
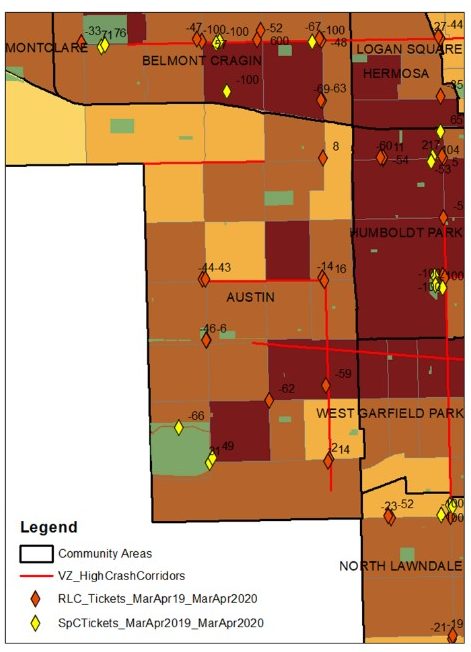
Red light camera and speed camera tickets, March 20 – April 21 in 2019 and 2020 in South Shore, Austin, and Uptown
Citywide, red-light cameras issued fewer tickets because the traffic volume decreased after many people stopped commuting to work.
People in communities sampled on the South and West Sides, however, were issued more red-light camera tickets as compared to the North Side.
This was because the South and West Sides are parts of the city where more essential workers live, and these residents were driving to and from work at higher rates than communities that have a lower concentration of essential workers. Speed camera tickets increased city-wide because of the reduction in traffic volume.

Crashes involving people walking, biking, and driving
Car crashes decreased city-wide because of fewer cars on the road during the stay-at-home order. In South and West Side communities, the number of car crashes did not see a major change from 2019 and 2020.
In North Side communities, the number of car crashes dropped drastically after the stay-at-home order as a result of people living on the North Side having a higher chance of working from home and not having to travel as much as essential workers.
With fewer cars on the road and people staying home, fewer pedestrian and bike crashes happened during the shutdown. Pedestrian crashes decreased overall, but still happened in the South and West Side communities more frequently compared to the North Side communities.
The change in bike crashes varied between 2019 and 2020. Some communities had a minimal increase or decrease, or they experienced the same number of crashes as in 2019.
Among COVID-19 deaths, people of color in low-income communities have suffered the most loss of life. Support for the communities hit hardest by COVID-19 should include improving mobility and safety conditions for all road users. This would make traveling for essential workers and others safer and more reliable.
Increasing safety in these communities — particularly on the most dangerous corridors — would allow people in these communities safer and more welcoming travel options.
Make a Donation
Your tax-deductible donation supports the important work that Active Trans does throughout the region
